Sunday, July 17, 2011

Starplots

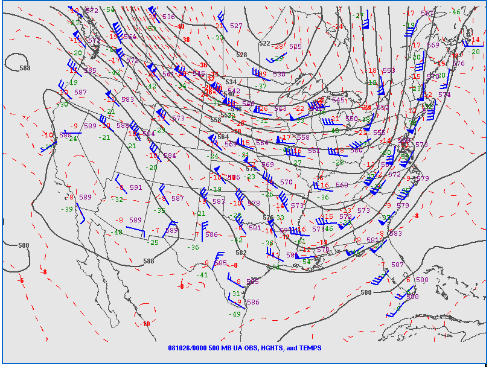
I wasn't quite sure of which type of star plot to post for this map. I know that a star plot for a map of the skys above can be very useful to navigators


http://www.trcb.com/travel/destinations/the-enigma-of-the-irish-round-towers-part-two-5970.htm


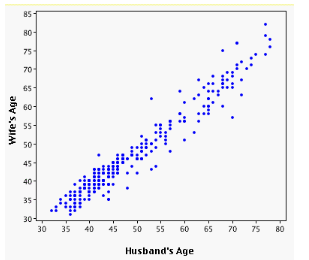
This is a star plot graph, mapping the differences between major metroplotian cities, in this case I believe that the different points repersent birth rates of different precentages of population class. I recently saw this type map used in a magizine to show the different types of transportation and the amounts of use the get. Also it showed the travel times used by each mode to get from outside of the metro area to the downtown area.


http://www.datavis.ca/milestones/index.php?group=1950%2B

Stem and Leaf Graph

Stem and leaf charts are an easy way to show information like this, test scores. The variable on the left shows the percentale like 90s or 80s. On the right side show the exact number inside that percentale. For example, in the 60s pecent, there is numbers 68, 64, and 63


http://www.mrnussbaum.com/mathdrills/graphing/stemandleaf.htm

Box Plot

This is a great example of a box plot diagram. To me this diagram is very similar to a scatterplot diagram, whereas the mean information of the variable is centered in the bow and the furthest outlining points are shown at the edges of the graphed data. The website where I found the information at is listed below. The website has a great example for a boxplot and shows the process by which the boxplot is made, which is through a stem and leaf plots.

http://edubuzz.org/blogs/nbhs3x1/2007/01/08/8-jan-2007-five-figure-summary-and-box-plots/

Histogram

Histogram's displays the frequency of information, mainly over a certain time period. This graph however shows the immagration numbers of four countries over a certain time period. The varibles being Demark, Norway, Sweden and the Netherlands. the X-axis shows the years or decades and on the y-axis is th population in thousands


http://gnuplot.sourceforge.net/demo/histograms.html

Parallel coordinate graph

A parallel coordinate graph is one that shows two mostly parallel coorinated line graphs. The inventor of the parallel coordinate graph, Alfred Inselburg gave a talk at Colombus University and even used this particular graph to expline his ideas.

http://www.stat.columbia.edu/~cook/movabletype/archives/2007/10/parallel_coordi.html

Triangular Plots

A triangle plot which is also known as a ternary plot, is a graph of 3 variables. It is most often used in geologic studies to show the relative compositions of soils and rocks, but it can be more generally applied to any system of three variables. This diagram displays a triangular plot area in S.W. England on which soil textures defined as proportions of sand, silt and clay are plotted.

http://www.oga-lab.net/RGM_results/plotrix/soil.texture.uk/soil.texture.uk_001_big.png

Windrose

This is a great example of a windrose diagram from Maine.gov. This type of graph shows the direction for the winds and how fast the gusts can be in that direction. Windrose graphs are a favorite graph to examine and like at. Information presented can be so vital to so many people who depend on a constant wind like the Engineers at a wind power plant. A captain of a sea sailing vessel may need it to understand the constant wind velocities.

http://www.maine.gov/dep/air/meteorology/Windrosehome.html

Climograph


Clinographs are important tools for measuring the amount of precipitation over an extended time period like this graph showing the amount of precipitation for Bolder, Colorado. The graph shows the most precipitation coming during the spring months. The graph also showed the mean temperatures during the months.

http://www.colorado.edu/geography/extra/geogweb/bouldercreek-2/preview/page2.html

Population profiles

This is an example of a population profile or population pyramid. These types of graphs show the data two variables on a bar chart that is shifted vertically. This can show the reader any sudden increase or generally level conditions. If the bar charts have any inconsistency then the read will notice it and take note. The example below shows the different patterns that populations of different countries might have. Like a rapid growth for Kenya which currently has over half of its population percentage under 20 years old. The United States has a much more stable growth or a slower growth, much of the population ages 60 to 40 year the post WW2 Baby Boomers. The graph of Germany shows an older population with no signs of increased growth ahead. This could be the cause of slowing down of birth rates or even more migration out of the country.

http://www.uni.edu/gai/India/India_Lesson_Plans/India_Population_Pyramids.htm

Scatterplot

This is a scatterplot graph and its purpose is to show these points as individual pieces of information. These repersented points show the location on the graph of the actual values, not of a mean or ajusted average. This will make the specific information important of how close the data is. However the main thing that someone may look for on a scatterplot graph would be a the outliners away from the average mean data. http://cnx.org/content/m10949/latest/


This is a good scatterplot example with the varibles on the Y-axis which are the the Wife's age and on the x-axis on the husband's age.

Index value plot

This is an index value plot showing the S&P 500 stocks over a ten year time frame. The Values are put up vertically on the y axis, while the x axis shows the number of days during this time period. Although the days on the x-axis are confusing, I still understand this graph and respect its findings.

http://onlamp.com/pub/a/onlamp/2005/11/17/r_for_statistics.html?page=2

Accumulative line graph or Lorenz curve

In economics, the Lorenz curve is a graphical representation of the proportion of thedata assumed by the bottom y values. It is often used to represent income distribution, where it shows for the bottom x of values. The percentage of households is plotted on the x-axis, the percentage of income on the y-axis. It can also be used to show distribution of assets. "In such use, many economists consider it to be a measure of social inequality. It was developed by Max O. Lorenz in 1905 for representing inequality of the wealth distribution." The concept is useful in describing inequality among the size of individuals in ecology, and in studies of biodiversity. It is also useful in business modeling and in consumer finance.


http://www.absoluteastronomy.com/topics/Lorenz_curve

Bilateral graph

Bilateral graphs are special because they can compare two sets of data to one another using the same x and y planes. This bilateral graph shows the trade-weighted index (TWI) of the Australian dollar between the ATWI weights.


http://www.rba.gov.au/publications/bulletin/2008/feb/1.html

Nominal area choropleth map

A nominal area choropleth map is a choropleth map that is used to display nominal data. This is a map with the number of electoral voters in each state and the prediction of the 2008 presidential election as of May 2008. The election in November went differently than expected with many states voting democrat.

http://politicalmaps.org/wp-content/uploads/2008/05/electoral-map-prediction-05222008.gif

Unstandardized choropleth maps

An unstandardized choropleth map most generally applies the raw numbers of data on a graph with an x & y axis.
http://www.fairplanet.net/2009/06/hog-farming-filth-and-flu/

Standardized choropleth maps

In a standardized choropleth map the data used are all shown relative to the same standard. This map, for example, shows population per square kilometer.
http://www.bbc.co.uk/scotland/learning/bitesize/standard/

Univariate choropleth maps

Univariate choropleth map displays a single data set using different colors and shades. This particular map shows the elections from 2004 but this website shows each presidential election snice 1960. Shown on this map is a graph of the United States and all the counties in the lower 48 states. Each county or district shows a different color or shade of blue or red. The more red a county is, the high percentage of republican votes in this election and likewise for the democratic voters.

http://www.princeton.edu/~rvdb/JAVA/election2004/

Bivariate choropleth maps

Bivariate choropleth maps show more than one variable on their maps. This can be extremly helpful when showing maps like this one
http://proceedings.esri.com/library/userconf/proc99/proceed/papers/pap171/p171.htm

Unclassed vs. Classed

I want to reword my last graph posted graph on classed choropleth maps and discribe both of the classed and unclassed graphs on one blog posting. Like this one shows the differences in mapping and how the information is repersented. The maps and information is the same, but the way we look and understand the graph is different. The legend show on the side of the classed map shows what the differences of shading mean and how the transitions are different.http://gis.depaul.edu/shwang/teaching/geo381/LN9.htm

Classed choropleth maps

Classification is commonplace in thematic cartography. It has been the most widely used maps for determining the differences between two different areas. The first choropleth map created by Baron Charles Dupin in 1826. 

Range graded proportional circle map

Proportional circle maps utilize simple discs of varying proportions to depict different values of a certain subject or area of study. This graph shows most of the countries of the world and shows there populations in these proportional circles and then graphs them with two other varibles like life expectence and income ratings per person. I do not have the hyperlike for this graph from the original website. This is taken from a fellow mappers blogsite. However I have been to the website before and used it extensively in my Globalization class. If you happen to know what website this graph came from please write it on the response page of this Blog site. Thank you.
http://ktmaps.blogspot.com/2010/07/proportional-circle-map.html

Thursday, July 14, 2011

DOQQ

DOQQ maps are made using many characteristics of an aerial image. This areal image uses geometric features of a map. Distortion is omitted so these images are used as flat maps. This image take from a photograph in Louisiana and turned into a computer image, you can observe the obvious displacement of the terrain around the Mississippi River and in the delta.

http://www.lacoast.gov/maps/2004doqq/

DEM Map

DEM maps or Digital Elevation Maps provide not only a detailed map of the land and features involved, but it allows one to make out the elevations and size of the topographic features on a 2D map. This type of map is invaluable to a business like Superstition Search and Rescue, which was one of the websites that I found during my search.
 http://en.wikipedia.org/wiki/File:Oregon_DEM_relief_map.png

DLG Maps

A DLG map shows the suburbs of a major metropolitan area, I think that it is the state of Pennsylvania and that it shows the metro area of Philadelphia.
http://www.dlg.nsw.gov.au/dlg/dlghome/dlg_regions.asp?region=region&regiontype=3


DRG

DRG maps are the most widely used raster graphics maps and help use to understand the topography and overall lay of the land. This particular website has alot of very useful GIS information on it.
http://lter.msu.edu/maps/gis_data.php

Isopleths

This is an Isopleth graph/map showing the ozone in the triangle. Readings on the right show what the measurements are and the website describes in detail how the information is gathered
http://www.unc.edu/~meagsmch/ozone/o3isopleth.htm

Isopachs

Isopach maps are used in varous forms and applications like this one made by Rice University


http://gulf.rice.edu/modBdel.html

Isohyets

How weather forcasting would be done in New Zealand and Tanzinia. The contours on this map are isohyets showing the month’s rainfall in 100mm bands.
http://www.scoop.co.nz/stories/AK0808/S00090.htm

Isotachs

An image taken off of the NOAA website, showing the weather patterns over the entire country. Interesting is that this is from a local inquiry of the town of Burlington, Vermont.
http://www.erh.noaa.gov/btv/events/28Oct2008/ua2.php

Isobars

Isobars are drawn onto a map and used to describe anything from wind speed and patterns to in drop in barometric pressure, like this map is showing here. This particular on shows a dramatic drop within a closed system of Low pressure.
http://www.newmediastudio.org/DataDiscovery/Hurr_ED_Center/Hurr_Structure_Energetics/Closed_Isobars/Closed_Isobars.html

LIDAR

This is a LIDAR photograph taken over ground zero. This particular set of photos was taken on September 27, 2001, only 2 weeks after the attacks. The webpage describes the imagery better and shows how it is used.
http://www.noaanews.noaa.gov/stories/s798b.htm

Doppler Radar

This is a very specific image that I found before and wanted to use it don my blog. This is a doppler radar and doppler infrared radar image taken from the Norman, Oklahoma weather department during one of the largest tornados to ever strike a downtown or a metropolitian area. You can look and see the bottom of the image has a small circle. That is the F5 tornado that is moving into the city.
http://www.tapestryinstitute.org/tornado/doppler.html

Black & white aerial photo

Black and white aerial photography gives us a unique view of places and especially cities with alot of concrete architecture. The concrete buildings glow in these kinds of pictures, and the asphalt streets become black with the cars visiable on top. This works for this image which is an aerial photograph taken of New York City streets.
http://www.123rf.com/photo_9479876_new-york-city-manhattan-street-aerial-view-black-and-white-with-skyscrapers-pedestrian-and-busy-traf.html

Infrared aerial photo

Great infrared imagery of the Wisconsin-Madison University Stadium. This image is a great example of an infrared aerial photo. This type of imagery is very useful for looking at things such as vegetation due to it being highly reflective to the IR spectrum. That idea really sticks out here. Note that the football field is not giving the same infrared imagery as the other vegetation because it is an artificial turf. By using this type of remote sensing process, we can more easily look at things that we may not be able to notice with our own eyes.
http://www.geology.iupui.edu/academics/classes/g303/Image_Interp/remote_sensing.htm

Cartographic animations

This map is from Wunderground .com, a website that provides NEXDAR radar for almost anywhere on the map. It is very user friendly and is helpful for anyone trying to get a detailed report on current weather patterns. A person can even go back 6 days to review that days radar and weather in the area.
http://www.wunderground.com/radar/radblast.asp?ID=TLH&type=N0R

Statistical maps

Statistical Maps are very helpful and useful for describing important data that can have many variables. This particular map shows not only the locations of these cities, but it also gives us the specific information to determine how much the population has grown and how much it is expected to grow.
Mega Cities of the World


http://www.skyscrapercity.com/showthread.php?t=1075987

Tuesday, July 12, 2011

Isometric Maps?

I found this map and was not sure what type of map it was or even if it was required in our mapping catalog. It is an Isometric map made and created on the game Sim City.  This is my favorite game and coolest way to learn about urban planning.

http://gizmodo.com/5313575/honey-someone-shrunk-hong-kong

Cartogram

Great discriptiuon of a Cartogram and the shapes that it can take. Which is shown from this example. This takes the state of California and shapes the counties into circles and squares.
http://www.ncgia.ucsb.edu/projects/Cartogram_Central/types.html

Flow Maps

This is a flow map. This type of map help show movement to different regions, while also showing the quantity and in this case the amount of goods sold or distributed.
http://www.mundi.net/maps/maps_014/

Isoline Maps

A metorologist uses isolines to differintiate the climates and weather patterns of the US, this is the most common map use see on the weeather channel.
http://www.kidsgeo.com/geography-for-kids/0034-isolines.php

Proporitional circle map

A range graded proportional circle map is a map that uses circles to show data that are divided into groups, like countries or states if in the US. The main object of this type is to make the size of the circle to correlate directly to the quantity for that data given in the symbol key. Like this map of the population of Europe.
http://www.d.umn.edu/geog/cartfolder/HTML%20Pages/Map-Types.htm[range+nicole.jpg]

Choropleth map

This is a choropleth map made to show the outcome of the 2000 elections that saw George W. Bush come away victourious from Florida. The circles in the map show what the majority of the voting populations were in age.
http://en.wikipedia.org/wiki/Choropleth_map

File:2004US election map.svg

Dot Distrabution Map

This is a dot distribution map of the US from the Census Bureua. Look at how the population disperses dramatically West of the Mississippi River.
http://www.census.gov/geo/www/mapGallery/2kpopden.html

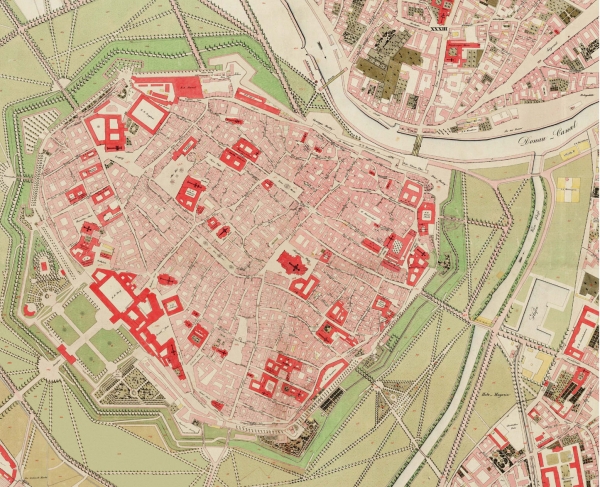
 One dot = 7500 people

Propaganda Maps

This map is a work of art, it shows the creepy crawling Octopus of the Soviet Union and its encrouchment over the rest of Europe.

http://georgiacraib.wordpress.com/

Hypsometric maps

Hypsometric maps represent the elevation of the terrain with colors. The area between two neighboring contour lines receives one specific tint. In this map of Tajikistan, the darker the color the higher the elevation.

rrcap.unep.org 

[Hypsometric+map.jpg]

PLSS Map

Perfect example of a PLSS map and its use in planning and understanding the townships around the region. This is in New Mexico and the county of Valencia which is located in the middle of this map and around the city of Albuquerque

http://octane.nmt.edu/waterquality/maps/plss.htm

Cadastral maps

This a cadastral map sheet of the cadastral survey under Emperor Franz I, 1817-1861 of Austria.

http://www.fig.net/hsm/news/frans_1_2007.htm

Thermatic Maps

This is another map of the Island of Hawaii, and specifically a thermatic map describing the different land reserves on the island and how they are divided up through the varous federal and state run departments.

http://www.creativemappingsolutions.com/maps/thematic/thematic1.html
Thematic map illustrating the breakdown of land reserves on the Island of Hawaii, including ownership and function.
Thematic map of the Island of Hawaii

Topographic map

This is a topographic map found on Wikipedia and shows the Island of Hawaii. The Interesting thing about this map is that it shows the togography of the terran from sea level and above. However the bathimetric maps would show a much different look of this massive sheild volcano. http://en.wikipedia.org/wiki/File:Hawaii_Island_topographic_map-fr.svg

File:Hawaii Island topographic map-fr.svg