This is a scatterplot graph and its purpose is to show these points as individual pieces of information. These repersented points show the location on the graph of the actual values, not of a mean or ajusted average. This will make the specific information important of how close the data is. However the main thing that someone may look for on a scatterplot graph would be a the outliners away from the average mean data.
http://cnx.org/content/m10949/latest/
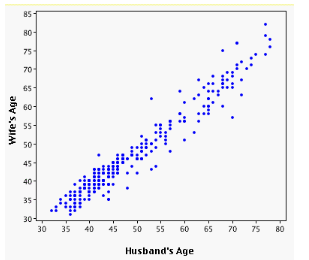
This is a good scatterplot example with the varibles on the Y-axis which are the the Wife's age and on the x-axis on the husband's age.
No comments:
Post a Comment