Sunday, July 17, 2011

Starplots

I wasn't quite sure of which type of star plot to post for this map. I know that a star plot for a map of the skys above can be very useful to navigators


http://www.trcb.com/travel/destinations/the-enigma-of-the-irish-round-towers-part-two-5970.htm


This is a star plot graph, mapping the differences between major metroplotian cities, in this case I believe that the different points repersent birth rates of different precentages of population class. I recently saw this type map used in a magizine to show the different types of transportation and the amounts of use the get. Also it showed the travel times used by each mode to get from outside of the metro area to the downtown area.


http://www.datavis.ca/milestones/index.php?group=1950%2B

Stem and Leaf Graph

Stem and leaf charts are an easy way to show information like this, test scores. The variable on the left shows the percentale like 90s or 80s. On the right side show the exact number inside that percentale. For example, in the 60s pecent, there is numbers 68, 64, and 63


http://www.mrnussbaum.com/mathdrills/graphing/stemandleaf.htm

Box Plot

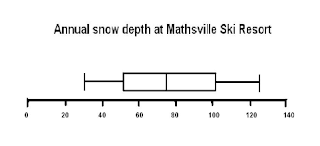
This is a great example of a box plot diagram. To me this diagram is very similar to a scatterplot diagram, whereas the mean information of the variable is centered in the bow and the furthest outlining points are shown at the edges of the graphed data. The website where I found the information at is listed below. The website has a great example for a boxplot and shows the process by which the boxplot is made, which is through a stem and leaf plots.

http://edubuzz.org/blogs/nbhs3x1/2007/01/08/8-jan-2007-five-figure-summary-and-box-plots/

Histogram

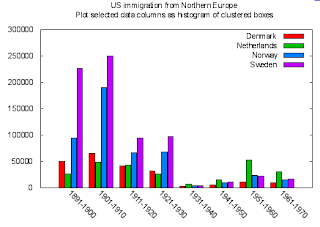
Histogram's displays the frequency of information, mainly over a certain time period. This graph however shows the immagration numbers of four countries over a certain time period. The varibles being Demark, Norway, Sweden and the Netherlands. the X-axis shows the years or decades and on the y-axis is th population in thousands


http://gnuplot.sourceforge.net/demo/histograms.html

Parallel coordinate graph

A parallel coordinate graph is one that shows two mostly parallel coorinated line graphs. The inventor of the parallel coordinate graph, Alfred Inselburg gave a talk at Colombus University and even used this particular graph to expline his ideas.

http://www.stat.columbia.edu/~cook/movabletype/archives/2007/10/parallel_coordi.html

Triangular Plots

A triangle plot which is also known as a ternary plot, is a graph of 3 variables. It is most often used in geologic studies to show the relative compositions of soils and rocks, but it can be more generally applied to any system of three variables. This diagram displays a triangular plot area in S.W. England on which soil textures defined as proportions of sand, silt and clay are plotted.

http://www.oga-lab.net/RGM_results/plotrix/soil.texture.uk/soil.texture.uk_001_big.png

Windrose

This is a great example of a windrose diagram from Maine.gov. This type of graph shows the direction for the winds and how fast the gusts can be in that direction. Windrose graphs are a favorite graph to examine and like at. Information presented can be so vital to so many people who depend on a constant wind like the Engineers at a wind power plant. A captain of a sea sailing vessel may need it to understand the constant wind velocities.

http://www.maine.gov/dep/air/meteorology/Windrosehome.html