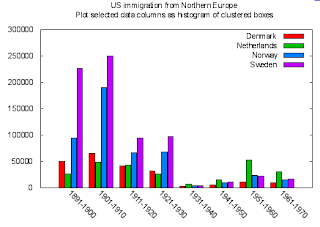
Histogram's displays the frequency of information, mainly over a certain time period. This graph however shows the immagration numbers of four countries over a certain time period. The varibles being Demark, Norway, Sweden and the Netherlands. the X-axis shows the years or decades and on the y-axis is th population in thousands
http://gnuplot.sourceforge.net/demo/histograms.html

No comments:
Post a Comment